Rapid Production Marketing
412.996.5700
  • Home
  • About
  • Articles
  • What we do
  • Launch Your Product
  • Speaking
  • Fees
  • Clients
    • What They Say
    • Auto & Truck
    • Manufacturing
    • Motorsports
    • Supply Chain
    • Organizations
  • Contact
    • Blog

Do You Truly "KNOW" Your Competition?

1/17/2018

1 Comment

 
Picture
“So it is said that if you know your enemies and know yourself,
​you can win a hundred battles without a single loss.
If you only know yourself, but not your opponent, you may win or may lose.
If you know neither yourself nor your enemy, you will always endanger yourself.”
– Sun Tzu

Several years ago all the rage in business books was Sun Tzu’s “The Art of Warfare." Many read the 18 chapters of the book, but few actually delved into a thorough analysis, or, more appropriately, knew how to begin an analysis.

Let’s talk about several methodologies.

Line-of-Business Analysis

Porter's 5 Forces
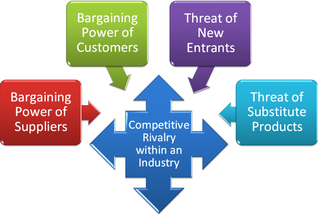
In 1979 Michael E. Porter of the Harvard Business School developed a framework for the industry analysis and business strategy development called the “The Five Forces”:

1. The threat of substitute products or services
2. The threat of the entry of new competitors
3. The intensity of competitive rivalry
4. The bargaining power of customers (buyers)
5. The bargaining power of suppliers

Without going into great detail and describing the “marketingspeak b-school” lingo, here’s what it boils down to:
​
1. What products do you make?
2. Whom do you compete with?
3. How well do you know your competitors?
4. Where is your product positioned relative to them?
5. How do you beat them?

A Real World Example

Now, let’s dive into some detail. You manufacture a variety of products that compete with other companies. Let’s pretend that you are an end mill manufacturer.

You make carbide end mills as a primary product and you have an offering of carbide burrs. Is the "burrs" product group going to be competitive?
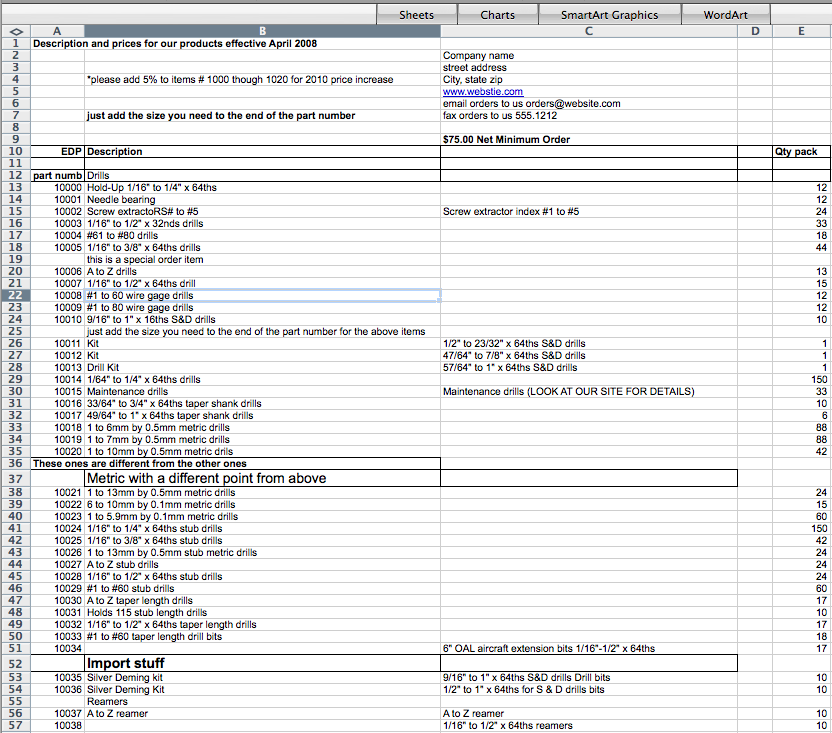
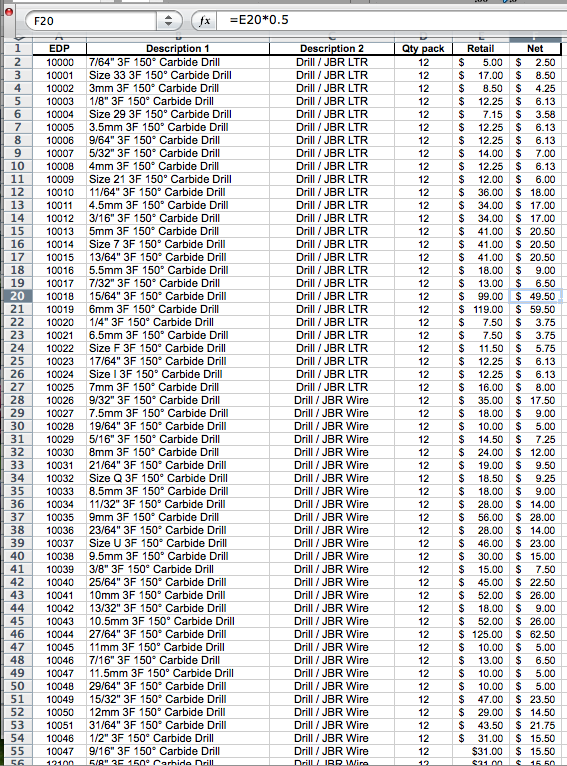
Your Products:
  1. A Style –  Cylinder Flat
  2. C Style – Cylinder Radius
  3. D Style – Cone Pointed
  4. E Style – Cone Radius
Who are your competitors in EACH category?
  • List them all. The first step is to understand who your competitors are.
  • List everyone you can think of and then ask other people within your company, your agents, and your distributors to add to the list. Get the list together.  Remember YOU will not know everyone and you might be surprised what comes out of the woodwork.
  • Break down your competitors by the product categories (in this case, the above 4 listed: A, C, D, E style burrs)
  • Do a SWOT analysis on each category.
  • Now, what else to those competitors make? Do you have the same solutions that they have?
What you might start with may look like something pictured here on the right.
​
Now if your primary product is making end mills and you “dabble” in making burrs how are you going to compete with someone who makes all of the following:
  1. A Style –  Cylinder Flat
  2. B Style – Ball
  3. C Style – Cylinder Radius
  4. D Style – Cone Pointed
  5. E Style – Cone Radius
  6. F Style – Tree Radius
  7. G Style – Cone Inverted
  8. I Style – Oval/Egg
  9. J Style – Flame
  10. K Style – Flame Large
  11. L Style – Tree Pointed
Picture
If you are using a distribution channel, the distributors are going to take the path of least resistance no matter what you do.  You may have a distributor owner telling you “We like you and we want to promote ALL of your products” but in reality, when an inside salesperson gets an order from a customer with A, C, D, E, F and G burrs on his purchase order it’s just easier to place that order with ONE vendor instead of two (and split the order) regardless of what the boss says.

So you’ll have some decisions to make:
Do you expand the offering so it is more complete?  
​Do you just keep the offering where it is at right now?
Are you willing to accept the fact that you will lose some orders within your channel if you don't expand?

At the outset you might not know.  But, that’s not important.  What’s important is that you MAKE A PLAN.  Then take the plan to the field.  See what feedback you get and ADJUST TO MEET THE MARKET NEEDS.
Line of Business Analysis
There’s a great company that does Line-of-Business analysis for you.  It might be worth a few minutes of your time to take a look at their website. They’re called : eCompetitors: Global Industry Dashboard

OODA vs. PDCA

There are two very good concepts you should understand in your planning process.  OODA Loops and PDCA.  I’ll take a minute and explain the basics:
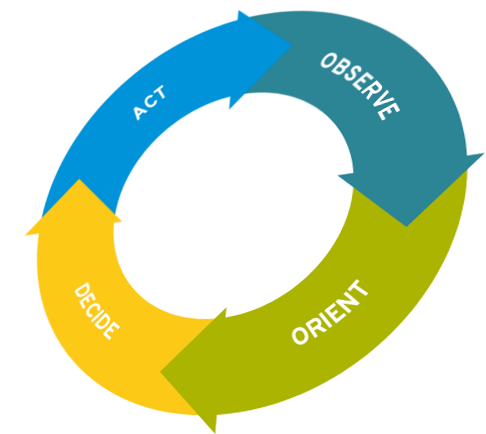
Picture
OODA
Observe, Orient, Decide, Act is a concept originally applied to the combat operations process, often at the strategic level in military operations. It is now also often applied to understand commercial operations and learning processes. The concept was developed by USAF  Colonel John Boyd.  In the fast paced world of business competition it’s a good idea to understand how fighter pilots are trained.

Boyd developed the OODA loop concept to explain how to direct one’s energies to defeat an adversary and survive. Boyd emphasized that “the loop” is actually a set of interacting loops that are to be kept in continuous operation during combat. He also indicated that the phase of the battle has an important bearing on the ideal allocation of one’s energies.  Basicially it comes down to this:
​
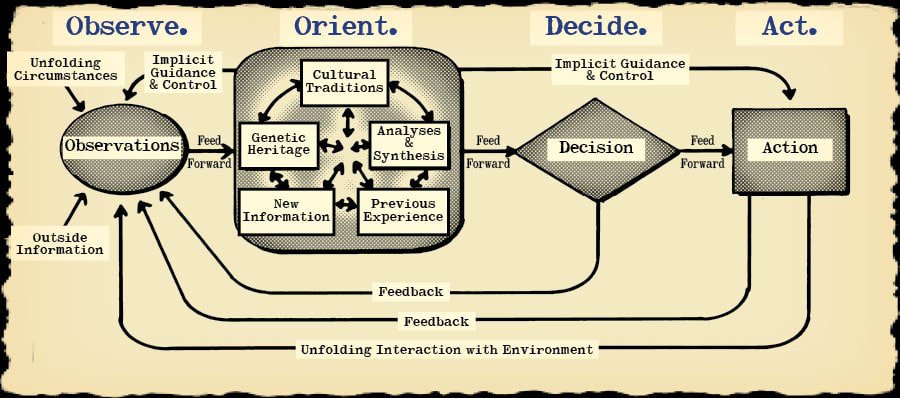
When the enemy aircraft comes into radar contact, more direct information about the speed, size, and maneuverability, of the enemy plane becomes available; unfolding circumstances take priority over radio chatter. A first decision is made based on the available information so far: the pilot decides to “get into the sun” above his opponent, and acts by applying control inputs to climb. Back to observation: is the attacker reacting to the change of altitude? Then to orient: is the enemy reacting characteristically, or perhaps acting like a noncombatant? Is his plane exhibiting better-than-expected performance?
Picture
PDCA
Plan, Do, Check, Act is an iterative four-step problem-solving process typically used in business process improvement. It is also known as the Deming cycle
  • PLAN – Establish the objectives and processes necessary to deliver results in accordance with the expected output. By making the expected output the focus, it differs from other techniques in that the completeness and accuracy of the specification is also part of the improvement.
  • DO – Implement the new processes. Often on a small scale if possible.
  • CHECK – Measure the new processes and compare the results against the expected results to ascertain any differences.
  • ACT – Analyze the differences to determine their cause. Each will be part of either one or more of the P-D-C-A steps. Determine where to apply changes that will include improvement. When a pass through these four steps does not result in the need to improve, refine the scope to which PDCA is applied until there is a plan that involves improvement.

Once again, the most important point in all of this is ADAPTION.

Now put on your thinking cap for a minute. Let’s pretend that you make burrs as a ‘convenience’ to some customers.  You’ve discovered that you’ve really been able to cut down your production cost.  So much so that you make a very healthy margin on the ones you do sell.

You have a competitor who started off making burrs.  It’s their core competency.  It’s where they got where they are and NOW they are is starting to make end mills: your core competency. What do you do?
Use the loops: Do the ACT part!

One possibility is that you offer a low price volume promo to your distributors in certain markets to get them promoting your burrs.  Target THEIR core competency!  Go after them where is hurts. Go after them in their strongest market.  BUT, make it a feint: While they are busy trying to keep marketshare, you can expand your business in your core markets.

Don’t be afraid of any of the processes listed.  I’ve heard manufacturers say “I’m just a small company, that stuff is for big companies”  My response is generally along the lines of “How do you think those companies got to be big companies?”
​

Finally, take a look at some other process’ that are out there.  If you can use an already created template to do the reviews and analysis then grab them and utilize them.  The Hoshin Strategic Planning process is a good starting point.

Hoshin Strategic Planning

“The hoshin process is, first of all, a systematic planning methodology for defining long-range key entity objectives. These are breakthrough objectives that typically extend two to five years with little change.

Second, the hoshin process does not lose sight of the day-to-day “business fundamental” measures required to run the business successfully.

​This two-pronged approach provides an extended period of time for the organization to focus its breakthrough effort while continuously improving key business processes day to day.”
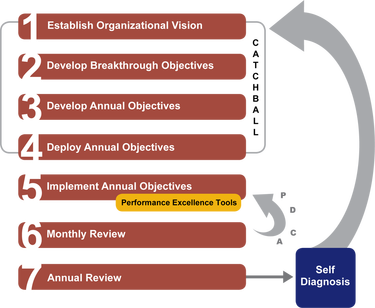
Picture
1 Comment

Sales vs. Marketshare – Are you Evaluating Market Potential Correctly?

10/18/2017

2 Comments

 
This article was originally published on an older version of this website in 2012.
The Evolution of a Field Sales Force
Business starts with a product or idea, someone goes out and sells something to someone near them. More customers are found and more is sold, typically, from the manufacturer directly to the end-user.
At some point the manufacturer of the product comes to their first crux point: One of two courses must be chosen:
1. Develop a Direct Sales Force
2. Develop a Sales Channel Strategy
Picture
Within these choices there can be any number of hybrid strategies:
  • A direct sales force that calls directly on end-users.
  • A direct sales force that calls on industrial distributors and sells through them.
  • A direct sales force that calls on “bigger” end-users directly and sells through a distribution channel.
  • An independent manufacturer’s agent network that does any of the above already listed.
  • Direct sales to industrial distributors.
  • The list can go on based upon individual companies and territories.
Generally, there are exceptions to every rule or SOP and, when pressed, all manufacturers will admit to “grandfathered” exceptions.

Picture
The real key to this is that in most cases the management of the sales channel “evolves” along the path of least resistance. There is, at most, a basic understanding of the market areas rather than a plan or “map” of success. Sales Managers evolve over time as well.

Think of a new sales manager like a fur trapper from the last century. He arrives as a tenderfoot and, over time, learns the lay of the land. He protects what he has learned and will only share what she knows with others whom she trusts.
Ok, so where does forecasting come into play? Typically sales forecasts also evolve based upon “What did we do last year and what do you expect we will do this year?”

There’s nothing wrong with that as long as you just want to do better than the previous year. Too many managers get caught in this closed loop system and fail to look deeper into the the business.

As an example, let’s look at that fur trader again. She’s hired a bunch of trappers and has a successful business. He’s impressed because over time, what used to be a terrible area for trapping has got a really hard working trapper and it’s delivering more business each and every year. But in the “great territory” he suspects that the trapper is not working. Times changed. The trapper in the formorly “bad” territory is sandbagging and only working a few days a week because the Beavers repopulated while in the former “great” territory it’s all “fished out”
​
But is that really what’s happening?

Sales vs. Marketshare

RULE #1: EVERYTHING in your forecasting should be about developing MARKETSHARE. 

Let’s jump back into some big picture stuff.

The reason for this is so that you can adequately gage performance in key market areas. If you gage how your territories are performing based only upon sales volume you will not know who is performing up to par and who is not performing.

If one market has a total market potential of $100M and another has only $4M and both territories are generating the exact same sales volume the territories are not equal. But how do you determine where the markets area? How big are they? How should you separate your territories?

I’m sure you’ve heard "Don't try to eat the whole elephant" but instead taking it one bite at a time. But where to start? Where is the target market for your products?

Marketing Campaigns & Military Campaigns

Let’s take a bit of a sidebar. If you understand that most management theory is based upon Military theory then perhaps the best thing to do is take a look at how the Military plans for success.
Operations Planning Model
Think about it: If someone is planning something where lives are at stake they are probably going a lot deeper than any marketing campaign you can envision. If you want a ready-made template for planning your marketing Campaign then take a look at The Campaign Planning Handbook from the US Army War College
​

One of the first things at the tactical level that the military asks is “What is the terrain?” They pull out a map.

Understanding How MSA's Evolved

Maps are a great visual aid to sales planning and forecasting. So, to start, let’s think about how North America was settled. As the westward expansion took place the United States originally set State boundary lines along easily definable geographic lines such as rivers or mountain chains.

​Although many boundaries are along rivers, cities developed on both sides of the river as a result of easy transportation along waterways.  Metropolitan areas developed around rivers. Boundaries for States and Counties where also created using the rivers.
Picture
The boundaries of States are not always the best way to define market territories
Market areas traverse the State Line boundaries.

County boudaries where essentially set up the same way. Population centers, and therefore business, developed along these same transport routes.

​That is why the concept of a Metropolitain Statistical Area, or MSA, is so important.
​
If you are measuring sales success by County it’s almost impossible to see any trends
County Boundaries Unites States

Temninology

The United States Office of Management and Budget (OMB) defines Metropolitan Statistical Areas according to published standards that are applied to Census Bureau data. The general concept of a Metropolitan Statistical Area, an MSA, is that of a core area containing a substantial population nucleus, together with adjacent communities having a high degree of economic and social integration with that core.

MICROs and MSAs are collectively referred to as Core-Based Statistical Areas or CBSAs

According to the 2000 standards
  • Each CBSA must contain at least one urban area of 10,000 or more population.
  • Each metropolitan statistical area must have at least one urbanized area of 50,000 or more inhabitants. Each micropolitan statistical area must have at least one urban cluster of at least 10,000 but less than 50,000 population.
Picture

Under the standards, the county (or counties) in which at least 50 percent of the population resides within urban areas of 10,000 or more population, or that contain at least 5,000 people residing within a single urban area of 10,000 or more population, is identified as a “central county” (counties). Additional “outlying counties” are included in the CBSA if they meet specified requirements of commuting to or from the central counties. Counties or equivalent entities form the geographic “building blocks” for metropolitan and micropolitan statistical areas throughout the United States and Puerto Rico.

If specified criteria are met, a metropolitan statistical area containing a single core with a population of 2.5 million or more may be subdivided to form smaller groupings of counties referred to as “metropolitan divisions.”
​
As of 2000, there are 362 metropolitan statistical areas and 560 micropolitan statistical areas in the United States. In addition, there are 8 metropolitan statistical areas and 5 micropolitan statistical areas. You can find a much more detailed map from this US Census Bureau link that you can print out

National Highway System

So why is this important?


If you undersantd that cities originally developed along transportaion systems you can understand how markets have developed. As the ‘west’ was settled cities tended to develop along river tranport systems.

​By the late 19th century streetcars led to the development of ‘suburbia’ and made room for the immigrant melting pot. Rail systems began to connect major metropolitain areas and by the mid 1960’s the interstate higway system started to connect the major MSA’s.
Picture
Average Daily Long-Haul Truck Traffic on the National Highway System: 2012

Terrain has a Direct Impact on Travel Time

To truly understand marketing areas you must have a good understanding of the topographical terrain and transport routes that support them. Today, markets develop along interstates. If  markets are disconnected there will be more “windshield time” between accounts.  When reviewing territories it’s always a good idea to understand the limitations imposed by terrain or traffic patterns.
Performance Evalutation
MSA maps are certainly better for taking a look at overall territory structures. Population centers are a good indicator of where business markets are located.

But to really drill down into where YOUR industrial business is located in the manufacturing sector,  you need to overlay a more detailed business map.
​
These kind of maps can be very very large and space does not permit here to depict one. So instead let’s look at some micro markets.
Three Digit Zip Code Map United States
 The US Census Bureau created the foundation of the ZIP Code system based upon population centers.

​MSA’s are a further refinement of that.

Understanding the Market Areas: A Real World Example

Now we’ll dig into the actual data a bit more. Let’s evaluate two sales territories: Northeast OH and Western PA for SIC codes 33-39.
Land Mass
  1. Territory 1: WV panhandle and Western PA = 39,205 square miles (Based upon 3 digit ZIP codes: 150-169; 249, 254, 260-268)
  2. Territory 2: in Eastern OH = 10,487 square miles (Based upon ZIP codes: 440-449)
Territory 1: Western PA
  • Total Companies = 7,306
  • Total Employees = 260,068
Territory 2: Eastern OH
  • Total Companies = 11,208
  • Total Employees = 435,368
SIC 33-39 Map Of Business NE-OH/W-PA

USMTO Market Growth Data

According to the June 2008 USMTC reports we know the following:
  • Northeast – PA north through New England – 08 sales versus 07 sales up 4.3%
  • Midwest – OH around through WI – 08 sales versus 07 sales up 81.5%
The Territory 2 market had grown substantially more than the Territory 1 market.:82.5% vs. 4.3%.


Territory Sales Comparison
So what to do we know?
At first glance Territory 2 had higher sales dollars. But when we dig into the numbers we can see that:
  • Territory 2 has only 60% of the land mass of Territory 1
  • Companies: Territory 1 has only 5/8 the number of companies in Territory 2
  • Employees: Territory 1 has only 5/8 the number of companies in Territory 2
  • Sales per Employees in territory 1 exceeded territory 2
  • Territory 1 experienced minor market growth compared to Territory 2
rritory Sales Comparison Example
Territory Sales Comparison Example
What can we learn from this?
​

The key to this whole discussion is understanding your markets. As opposed to basing your forecasting on past experience or “gut knowledge” of a market area take some time and dig into the data
Marketshare Potential is probably the best way to gage your success.

Key Questions to Ask:
  • Do I have a good understanding of where all of my markets are?
  • Do I have a good understanding or market potential in each territory?
  • Do I need to look at travel time between accounts?
  • Has business developed right around the corner from me that none of my salespeople are calling on?
  • Should split at territory?
  • Should I enlarge a territory?
  • Are my territory boundaries set up correctly?

References

"Standards for Defining Metropolitan and Micropolitan Statistical Areas; Notice." Office of Management and Budget. Federal Register. 27 December 2000.
U.S. Bureau of the Census. "Metropolitan and Micropolitan Statistical Area Definitions." 19 January 2006. Available from http://www.census.gov/population/www/estimates/metrodef.html. Retrieved on 17 April 2006.

Further Definitions of Statistical Areas

Core-Based Statistical Area
A CBSA is one or more counties with an urbanized cluster of at least 10,000 people. The area as a whole is defined by the interaction between the core and the outlying areas. This interaction, measured by commuting, means that at least 25 percent of people in outlying areas are working in the core. The CBSA is a generic definition of MICROs and MSAs, the difference being core population size.

Micropolitan Statistical Areas
A MICRO is simply a small CBSA, i.e., a county or counties with an urbanized core of 10,000 but fewer than 50,000 in population. Outlying areas included are, again, defined by commuting patterns. As of November 2004, according to the Census Bureau, there were 575 MICROs in the U.S. and five in Puerto Rico.

Metropolitan Statistical Areas
An MSA has an urbanized core of minimally 50,000 population and includes outlying areas determined by commuting measures. In 2004, the U.S. had 361 MSAs and Puerto Rico eight.
2 Comments

Customer Support: How it Can Cost You Sales

8/9/2017

2 Comments

 
In a previous article we talked about Why Brand Introduction Fail.  This articles digs a bit deeper in the the Customer Support question.
Introspection: Customer Support Questions
  • Is your field support and customer support team trained and up-to-speed on all of the products?
  • Can they technically support the product line?
  • Can they cross-over competitive information?
  • Do the support people Do you hear them saying “I don’t know the answer to that” and end the conversation with or do they say “I don’t know the answer let me find out and call you back in 10 minutes”  Do they end the call with "Are your happy with my your level of service today?”
  • Are they responsive?
  • Are they proactive?
  • Do you have a Standard Operating Procedure on quote turnaround ( 2 hours, 24 hours, 2 weeks)? 

​Inside Customer Service and Support can take on many variations. I've listed a few for you to ponder. ​

Customer Service IS the Problem 
​It once took me 6 months trying to figure out why we weren't getting more orders and why were where having order delays. The end-users loved the product, the outside sales people loved product, the owners of the distributors loved the product.

​It wasn't until I found out that the inside sales people placing & expediting the orders HATED dealing with the customer sales people at the manufacturer's order desk.  We had a flat tire where the rubber met the road.  

It only takes one component to fail for the system to break down.

Fearful Customer Service Problem 
Their is some internal political issue with a POLICY of the manufacturer that is so out of the norm that you can't even understand what is demotivating everyone.

Here's an example: At the end of a quarter every call made for an guarantied test trial application is responded with "I'm not sure if that's a good test."  Even in cases where the promo video that the company produced for the sales people has almost the exact application featured! Finally, after much prompting you find out why:
  • "The accountants are really tightening up on trial applications/test tools"
  • "My boss is really riding me on any testing right now"
  • "I've gone over my trunk stock budget" 
  • "We didn't anticipate the great response to the product so we're trying to control sales"

Don't create a promotion if you can't get the support of all of your internal departments.  

The New COST CENTER Problem 
​Sometimes, as companies grow or get sold there are new people who very well versed accounting and legal. If they don't fully grasp what has made the company successful they can wreak havoc at the sales generation end of the business.

In most cases, it's good business, stuff the company should have been doing all along, but in others, it's policies and procedures that just create roadblocks to doing business.

I was sent this video back in 2006 by a very astute owner of a manufacturer.
2 Comments

Where are Your Industrial Customers

1/11/2017

0 Comments

 
You're contemplating a new product launch and you're digging into where you think you might be able to sell your product.  At some point, you are going to want to determine what size company your are targeting.  This post should provide you with some food for thought.
Machine Shop Pie Chart by Number of Employees
Company Size of Machine Shops by number of Employees
To understand the above Pie Chart you're going to need to spend just a few minutes looking.  That Pink area on the right with the bar graph depicts only those companies in the pie chart with greater than 100 employees.

That is in the entire US machine shop market.

As you can see, the bulk of the business is in small business.  Machine Shops with under 20 employees.  Granted, it's great to get the really big machine shops to convert to your products and implement it throughout their facilities, but the smaller companies are going to require much much more work to get to them.

If you decide that you want to target the smaller machines shops there's both good news and bad news:

The Good
Smaller Shops can make decisions quicker.
The owner is generally the decision maker and not far removed from the production floor.  
Payment is generally quicker.  Larger shops tend to be slower pay than small shops that value the importance of maintaining credit.

The Bad
You will have to make many more calls and learn to establish credibility and rapport.
You can't hide any minor errors or omissions.  Each of your products that are purchased are going to be needed and quality is going to be expected.
0 Comments

Trust: The Most IMPORTANT Factor in the Supply Chain

10/12/2016

1 Comment

 
Secrets of Manufacturer's Reps
,Is there trust in your business relationships?  Trust is that "gut feeling" stuff. It comes out in the one-on-one conversations.

Ask yourself: Is something being held back? Are direct answers given? Do you give them? Do you get them?

In the Agents and Distributors minds they are constantly re-evaluating each conversation and each slight policy change. 
  • "Is the manufacturer asking lots of questions because they want to sell directly to my customer?
  • "Am I being eliminated?"
  • "Do they want to move the business to a competing distributor?"

Is the manufacturer "throwing their weight around" and not really acknowledging that the distributor runs their own business?
​Does the agent or manufacturer call the end-user directly.... and not tell the distributor or independent rep? Do they visit end-users on their own? Is there communication when they do?

The most successful brands are built on a foundation of trust and loyalty. Each party knows where the other stands. You can actually watch the relationships grow.

In the early phases it may be that the distributor or the agent calls up the manufacturer and asks for something... The reprimanding parent response is "You know we can't do that! We can do xxxx." To which the smiling reply is "I know, but I had to ask."

Later, as the relationship evolves, when the distributor or agent calls up they say "Hey, we just promised this program and that promo with this product, I know I need you to approve it but I already quoted it while you where on vacation" and the response "Great Job, what else ya need?" 

Perhaps, more than any other part of the business relationship, TRUST IS THE MOST IMPORTANT. 

Whose Customer is is anyway?
Many times manufacturers who use the industrial supply chain become confused as to who their actual customer is.  The customer is the one who writes you the check.  If you are selling directly to the end user of your product then that end-user is the customer.  If you are using a wholesale supply sales channel, the person writing you the check is YOUR customer and the end-user they are supplying your products to is THEIR customer.  

The "Agent" or "Regional Manager" 
An agent or territory salesperson has a relationship with his customer: The distributor channel. It's where they live, It's where they put food on their table. Most of the smart independent agents, and even the factory guys, realize that the relationship is the most important aspect of their livelihood.

Agents realize that Management comes and goes, manufacturers change gears, different managers come on-board with their own ideas and their own relationships, but the one consistent thing is their customers and that trust they have built up.   Although you as the manufacturer may be writing the regional manager the check, they realize that that check is being generated from the relationships they have in the territory.  If the regional manger has put down roots.  Has a house, has a Family, has kids in school, They have "gone native."  They are going to be more loyal to the territory than to you. It's good to remember that in all of your conversations with them.

The Distributor 
Distributors are even more protective of their turf. They have their territory marked and that IS how they perceive it. It's THEIRS.   When a distributor brings someone into their customer it is akin to bringing your first date to meet your parents. You are coming into THEIR home, you are being extended the relationship that they enjoy. When a manufacturer tells them "That's MY customer not yours" they are pretty offended and, like a dog, they'll probably come back and bite you. They own the relationship. 
1 Comment

Getting Global-burgh

9/19/2013

1 Comment

 
Pittsburgh is rapidly becoming a hub of innovation and is attracting international business. This discussion on August 2 2012, took a look at several opportunities & introduced several resources that entrepreneurs can utilize to grow their business internationally from the Western Pennsylvania area.

Presented by: Jessica Lee’s Entrepreneurial Thrusdays 
Co-host Bernard T Martin, www.rpmconsultants.us/President, Rapid Production Marketing 

Thomas Buell, Jr., APR, Director of Marketing
Global Pittsburgh
Improving the region’s global competitiveness by creating long-term relationships connecting the Greater Pittsburgh community with international leaders and influencers.

Brian Tamburro, Senior Director for Strategic Initiatives,
CED Faculty & Staff : Carnegie Mellon University’s Heinz College
Center for Economic Development Carnegie Mellon Heinz College.
CED affiliated faculty and staff serve as advisors and administrators for CED system synthesis projects. The knowledge, experience, and interests of the faculty reflect the Heinz College’s interdisciplinary approach to policy analysis. Individuals have engaged policy and management questions in economic development and its related domains from a variety of disciplinary vantage points, with a variety of tools, in a variety of roles including researcher, practitioner, and policymaker
​
Steven Murray, Senior International Trade Specialist
U.S. Commercial Service 
The U.S. Commercial Service in Pittsburgh is your first stop on the road to exporting success. With over 30 years of experience assisting Western and Central Pennsylvania exporters, our trade specialists provide you with the knowledge and support you need to start or expand your export markets.

Getting Global-burgh from Bernard Martin on Vimeo.

1 Comment

Why You Might NOT Want to be LinkedIn with Someone

7/17/2013

0 Comments

 
Picture
I was sent an invitation to connect with someone who’s newsletter I have been receiving for many years.  I found the information very informative and helpful in many cases.  However, when I talked to him about his locked down connections he told me “I don’t want my competitors to see who I know”  I explained that
  • A. I wasn’t a competitor,
  • B. Perhaps he should be connected to his competitors if he is that unsure of his customer relationships and
  • C. It’s difficult for me to trust people who don’t seem to trust anyone else, as I find that the people most paranoid about trust are almost always the most untrustworthy people I meet.
Remember, you don't have to connect with everyone.  Just because you've been friends with them in-person, that doesn't mean that they are just as friendly on-line.
0 Comments

Manufacturing's Twitter adoption: Your Results May Vary

8/17/2012

1 Comment

 
Picture
This article originally appeared in Business 2 Community.

​Be sure and check for comments there as well.

Twitter adoption rates appear to vary between various segments within the B2B categories, but if the GENERAL industrial sector is an indicator of adoption, then it is outpacing the general population’s adoption much more quickly than other sectors.

Way back on March 21, 2011 Twitter celebrated it’s 5th birthday: “200 million users and 1 billion tweets per week”. Had it hit the mainstream audience and what was the adoption rate in the industrial sector? In November 2010 Pew Internet & American Life Project surveyed more than 2,200 US adult web users and asked, “Do you use Twitter?” Their findings:  8% of all respondents said yes.  But quite a lot has changed since those days.
​
However, it’s important within the context of what adoption rates really mean.  So let’s first explore that first and then review some of the historical data now that their is actually some historical data available.

What’s an Early Adopter?

An “early adopter” is an early consumer of a technology; in politics, fashion, art, and other fields, this person would be referred to as a trendsetter. The concept was outlined in Everett M. Rogers‘ 1962 study “Diffusion of Innovations” Although the segmentation of what defines an early adopter has been modified over time, Rogers felt that the crux point between “early adopter” and the next phase, “early majority”, was around 15%.
Early Adopters Graph
Crossing the Chasm
By Roger’s standards,  in 2011,  Twitter was in the “early adopter” phase within US population.

​As computers, the internet and electronic technology began to take hold in the 80’s & 90’s  
Geoffrey A. Moore defined “The Chasm” in early adoption.  

Manufacturing Sector Twitter adoption

​According to Moore, in his 1999 book, “Crossing the Chasm” he defined the chasm as “The most difficult step is making the transition between visionaries (early adopters) and pragmatists (early majority)”. This is the chasm that is depicted in the second graph. Moore went on to say “If a successful firm can create a bandwagon effect in which enough momentum builds, then the product becomes a de facto standard“

In early 2010, GlobalSpec released “Social Media Trends in the Industrial Sector.” The 2010 study found that “At this point, only 9% are using Twitter.” On Feb 22, 2011, GlobalSpec released “Update: Social Media Trends in the Industrial Sector”as a follow-up to their 2010 study.

​The 2011 study was quite revealing.  It indicated 
“Currently, only 15 percent have a Twitter account” GlobalSpec’s recommendations for using Twitter where, to say the least, in the “not recommended” category.

​By early 2012 marketing adoption, according a new updated  report,  “Social Media Usage in the Industrial Sector” was released from GlobalSpec. According to that report, Twitter usage had now increased to 22% amongst respondents to the survey.

Population Twitter adoption

At the same time that GlobalSpec was doing their niche surveys regarding industrial adoption, Pew continued to complete their more general adoption rate studies for Twitter as well. To review:
  • 2010: 8% of Americans us Twitter
  • 2011: 13% of online adults use the status update service
  • 2012:: As of February 2012, some 15% of online adults use Twitter

Comparing the Statistics

Twitter Adoption Manufacturing Community
When we overlay the data from both studies what we find is the the industrial sector seems to be adopting Twitter more quickly than the general population. Both have now “crossed the chasm”
Let’s just summarize for a moment what the data tells us:
  • Somewhere around 15% “early adopters” become “early majority” and that is when the slope of the bell curve goes UP
  • “The Chasm” is between 8-12% adoption. It has been crossed.
At first glance this would seem to indicate that the industrial sector is adopting Twitter at a much more advanced rate than the general population: That may not be the case within certain vertical markets. First, there are some some obvious caveats with the last chart:
  • Comparison between different population studies is always prone to error and we need to acknowledge that.
  • Within the Industrial sector there are business “silos” (vertical markets) that include, not only the entire supply chain, but also the end user base of customers. The “industrial population” data from GobalSpec does not contain ‘refined data’ for these individual vertical silos.

What that means

Various articles both here on the B@B Community site and others websites have been, on one hand, big advocates of Twitter, and on the other,  have had a rather antagonist view of twitter.  It would seem that both views have merit: It all depends on which vertical silo the anecdotal observations are being made.

What we have observed

There are three very large industry trade shows coming up in North America. The International Woodworking Machinery & Supply Fair (IWF)  in Atlanta, The International Manufacturing Technology Show (IMTS) in Chicago and the FABTECH show in Las Vegas. The IWF show serves the woodworking vertical industry, IMTS serves the metalcutting market and FABTECH serves the welding and fabrication markets. All are within the ‘industrial’ sector.

​However, based upon our observation (because segmented analytics are near impossible to obtain or analyze) these industry silo’s vary in adoption. Of course both have a significant involvement  in Twitter at the equipment manufacturer level but from there the segments begin to vary. Whereas the ‘woodworking’ sector has a good many woodworking (end user)  shops  with a Twitter presence the metalcutting and fabricating sector has little participation at the ‘end user” level, comparatively speaking.

Why Twitter adoption may vary

In the 1950’s Soloman Asch completed a study which is often called “Asch’s Paradigm” He concluded that within groups of people there was evidence that the power of conformity was a factor in adoption of ideas.  Basically, it comes down to peer pressure. Certain industry segmented vertical silo’s have been affected by the social influence of their peers sooner than other silo’s.

Conclusion

So what that means is that “Your results may vary” and you should take that into consideration as you begin to develop your Twitter Strategy moving forward.  It is almost certain that more and more adoption will begin to happen at a faster pace moving forward because we have “crossed the chasm”. And don’t forget to leave some room in your tactical plan to account for additional adoption within your vertical silo segments.
1 Comment

Have you Standardized your Price Lists? Is it Import Ready?

6/6/2012

1 Comment

 
This was  a special report I created for the 2010 International Manufacturing Technology Show exhibitors.  ​I'm reposting it here for the 2012 IMTS Show exhibitors.
IMTS 2010 Logo
If you are selling through a distribution channel then the DISTRIBUTORs are the FIRST customer who’s needs you should meet. I’ve seen many manufacturer’s who have great products, great catalogs, and yet they can’t figure out why they are not selling more.  Somewhere there is a hurdle.  

Sometimes the hurdle is in the last place you might expect because you don’t see it every day or feels it’s effects personally.
​
You’ve paid for the catalog, you’ve paid for the marketing, you’ve found a good distributor, you had a great sales meeting and the outside salespeople are excited to go show their customers your product.

What happens next?
The end-user customer asks for a quote. Now that goes directly to the inside people at the distributor. They now have to create a quote, and when they do it,  they don’t want to have to enter the same information over and over again. If one customer wants something “just like my buddy Joe got at his place” they have to standardize.

Here’s a couple of cases where the manufacturer slipped up:

PDF issues: The Old Established Company

These folks have a great product and printed price list. They’ve been in business for many years and have a great printed price list. Because they’ve been in business such a long time their part numbers and descriptions where entered years ago at the advent of databases when distributors first embraced computers.
They supply their price list in a PDF format. Creating price lists in PDF or MSWord is great for printing but we live in an world of databases. If there is no way to import the fields then everything has to be manually entered or was entered manually.

​Internally the inside sales people within the manufacturer knew that when they got the purchase orders from a particular distributor the part numbers looked different. One may have in their database “part# 32.476.198” while another had “part# 32-476-198” and still another had “part# 32 476198”. 
Industrial Distribution Manufacturing Database errors
Don't do THIS!
Human beings reading a fax can understand that. However, as more and more larger distributors move to EDI or other forms of electronic order entry this inconsistency can become a big problem. Computers understand spaces, “-” and “.” as different items.
Remember, “Garbage In, Garbage Out” If you want consistency and standards don’t let it up to an inside salesperson at a distributor, who is rushing to enter and order to get to a customer, to enter your part number, description and pricing.
​

We are going to see more and more electronic databases being used. If you have not standardized your price lists yet you may want to get started so you have time to think it out and plan accordingly. You don’t want to be put into a position of rushing to complete only to discover you should have created it differently.

Older Software: The Storage Company

This manufacturer created the price list In excel, but, it just would not load: There was a problem with importing. Something seemed incorrect. When the distributor contacted the manufacturer their comment was “Well, everyone with a Mac has a problem. You should get a PC.”

As it turns out the excel was a trainwreck: Several people had worked on the file over time. The first person did not have a good working knowledge of excel and collapsed some columns. Column B was collapsed at some point in the creation of the file and some of the product descriptions where there while other product descriptions where in Column C.

In addition to that there was a mixed standard of descriptions. As an example, one description read “Cabinet Tall 36″” while another read “Tall Cabinet 36” but they both had 
different part numbers.

Once again, inside sales people who are in a rush to enter orders become quickly disenchanted with vendors who make their life difficult.

​If it’s not easy and intuitive, you can have the best product in the world, the best sales force, the perfect price point but you will lose orders because you’ll be branded as “They’re just tough to work with”

The “non standard” Standard

Distributors work with many many manufacturers and are very familiar with how jobs are “routed” through a facility. So when a distributor talks to a vendor and the vendor says “If you want it in black just add a “B” to the part number at the end. If you want it in Gray – just add a “G” There is no charge extra for that either, just add a “G” to the end. That’s what our guy use on the floor”

Aside from the above discussion about how computers would understand a “-G” vs. a “.g” there is a larger perception problem in play here. What may seem like a rather simple way to designate what color you want actually raises a big red flag for the distributor. They know that the way one person writes a “G” could look like a “B” to another person.

Even if the “guys on the floor” know enough to ask someone to double check, distributors know how important accurate information on the floor of a plant is to efficient delivers. It’s the real basis of “lean” “SPC” “ISO” etc. Again, what the manufacturer perceives as a “simple easy to use, ‘just add a letter’ system” what the distributor hears is

​“Our shop routing process is a real mess so this vendor is probably going to be late or mess up an order at some point. I’ve got to keep an eye on them”
For further Reading check out: The Future of Industrial Classification: UNSPSC
1 Comment

The Future of Industrial Classification: UNSPSC

1/11/2012

1 Comment

 
As we get deeper and deeper into a global economy there are some things you should be aware of that are developing.
Picture
UNSPSC is the acronym for the United Nations Standard Products and Services Code, it is a coding system to classify both products and services for use in the eCommerce. The UNSPSC was jointly developed by the United Nations Development Programme (UNDP) and Dun & Bradstreet Corporation in 1998. 

It is currently managed by 
GS1 US, which is responsible for overseeing code change requests, revising the codes and issuing regularly scheduled updates to the code, as well as managing special projects and initiatives.

Eventually, you are going to have to attach a UNSPSC code to all of your products.  Take a peek at the link above to understand it a bit better.

Labor Costs

“We’ve been doing it this way for years and no one else has complained”  If I’ve heard that once I heard it a thousand times.  Maybe, they stopped complaining years ago and maybe, just maybe, your never even heard the complaint.  Let’s look at some dollar and cents.

If someone at an end user keys in an order and faxes it to a distributor, that distributor keys in the order and faxes it into the manufacturer.  The manufacturer keys it into their system.  The product ships and a hard copy of the invoice is sent to the distributor who must key in some more information,  then the manufacturer sends out a printed copy of the invoices to their agents.  The agents then key in the sales again.  

That’s an awful lot of repetitive keystrokes folks.  

​It’s pretty easy to see why moving to electronic databases and communication is happening and is going to move to a standard.

Standards

So what are the field names you should use if you don’t have something already?  Here’s a rough outline:
  • Part Number
  • Description 1
  • Description 2
  • Package Quantity
  • Retail/List Price
  • Distributor Net/Discount from List/ and/or multiplier from list
Those are good column headings for your spreadsheet.  

Outside of THOSE headings there should NOT be any other row that describes something about a set of items.  If there is information that applies to the entire group of items (rows) then each item should have that same information.

To the right you will see an example of something that is ready for import.  Notice how it is different from the spreadsheet pictured above.  

There is one column heading throughout.  This is really not for viewing but for importing.
Non UNSPSC Database Coding Industrial Distribution
Details Details
But there is ONE error in the picture. Can you see what it is?  To be honest, you would probably not even catch the error.  Take a look at the FORMULA in the highlighted cell.  It’s a formula and not text.  The pricing columns all have dollar signs in them.  That’s a nice thing to do if people are going to read it but the computer has to import it.

There have been cases where distributors said “Wow this is a great file and ready to import!”  but then the import went south with strange errors.  It wasn’t the dollar signs,  it was the rounding.  There was multiple column pricing for quantity breaks.  

Everything was a formula and when it was converted to text it had numbers that where out 6 decimal places. Because the formula’s where all based upon one cell as a baseline, the rounding errors got bigger and bigger and when the import happened the pricing was up to .27 cents off on certain items.  That can add up if they standard package quanity is 144 pieces. Why did it happen? Because when the import was done it only imported the first two decimal places.

Once you’ve completed your spreadsheet save all of the fields as TEXT and this problem will go away.
Details Details and more Details
Some other things to consider: What software system do your distributors use to run THEIR BUSINESS?  It’s a good idea to ask.  You may have field length issues when importing.  

​If you have a Description 1 field that is 100 characters long but the field in the software only permits 43 characters, with the rest being parsed, that information IS NOT going to be in the database.  If you have one critical dimension at the end of the description and upon import an entire group of items is parsed all of the part numbers will be different but the descriptions will all be the same.

“Well, we can’t make 100’s of special prices list for EVERY distributor” you say.  You don’t have to.  Just find out what the software is at your key distributors and accommodate them.

“Again, no one has really complained about this before so we don’t think it’s a big issue”

When do you update price lists? When you introduce a new product or have a price increase. Right?

Now, what does a good outside sales force do when there is a change?  They have a sales meeting with the distributors to review the new products (and new catalog) and get the distributor salespeople pumped up to go out and sell.  In many cases this is happening as soon as the new price list is put out… in some cases your sales force is brining it with them.

Is the IT person in the room for the meeting?  Generally the answer is no.  Does your outside sales force commonly work with the IT people at a distributor?  Do they even know who does it if you ask them?  Generally, the answer is no.  When the IT person gets the file, if they discover it’s going to take some time to clean up it gets put on the backburner, especially if their primary responsibility is accounting or other back office work.
​
So what happens in the field? Your salespeople go out, make calls with the distributor salespeople and get some orders.  They place the orders.  The price list isn’t updated so they spend the next couple of days fielding questions, dealing with distributor inside salespeople and your customer service people.  They aren’t selling.  You’re losing money and you’re getting a “difficult” to deal with reputation.

Take Aways

  • Take a look at your price lists.  Are they easy to import?
  • What software are your distributors using?  Are your price lists easy to import?
  • Have you ever called your distributors and asked them what they would like to see improved or changed in you price lists to make their job easier?
1 Comment
<<Previous

    Author

    Bernard Martin

    Archives

    January 2018
    October 2017
    August 2017
    January 2017
    October 2016
    September 2013
    July 2013
    August 2012
    June 2012
    January 2012
    April 2011
    March 2011
    February 2011
    January 2011
    December 2010
    November 2010
    October 2010
    September 2010
    August 2010
    June 2010
    May 2010
    April 2010
    March 2010
    December 2009

    Categories

    All
    AMTDA
    Business Analysis
    Database
    Facebook
    IMTS
    Industrial Distribution
    Industrial Marketing
    LinkedIn
    Machinery Dealer
    Machine Shop
    MSA
    NLP
    OODA Loop
    PDCA
    Price Lists
    SEO
    Small Business Marketing
    Social Media Management
    Social Media Marketing
    Speaking
    Strategic Planning
    Twitter
    UNSPSC
    USMTO
    YouTube
    Zip Code

    RSS Feed

©2023 Rapid Production Marketing        232 Dogwood Circle Baden, PA 15005-2346      412.996.5700