
This article originally appeared in Business 2 Community.
Be sure and check for comments there as well.
Be sure and check for comments there as well.
Twitter adoption rates appear to vary between various segments within the B2B categories, but if the GENERAL industrial sector is an indicator of adoption, then it is outpacing the general population’s adoption much more quickly than other sectors.
Way back on March 21, 2011 Twitter celebrated it’s 5th birthday: “200 million users and 1 billion tweets per week”. Had it hit the mainstream audience and what was the adoption rate in the industrial sector? In November 2010 Pew Internet & American Life Project surveyed more than 2,200 US adult web users and asked, “Do you use Twitter?” Their findings: 8% of all respondents said yes. But quite a lot has changed since those days.
However, it’s important within the context of what adoption rates really mean. So let’s first explore that first and then review some of the historical data now that their is actually some historical data available.
What’s an Early Adopter?
| An “early adopter” is an early consumer of a technology; in politics, fashion, art, and other fields, this person would be referred to as a trendsetter. The concept was outlined in Everett M. Rogers‘ 1962 study “Diffusion of Innovations” Although the segmentation of what defines an early adopter has been modified over time, Rogers felt that the crux point between “early adopter” and the next phase, “early majority”, was around 15%. | 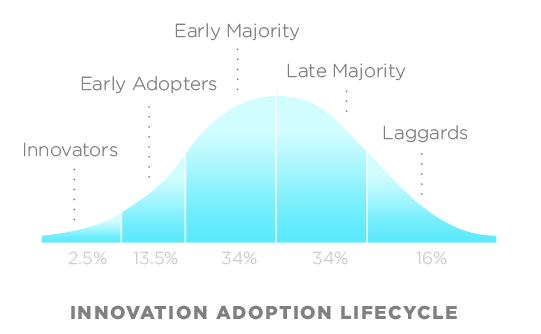 |
 | By Roger’s standards, in 2011, Twitter was in the “early adopter” phase within US population. As computers, the internet and electronic technology began to take hold in the 80’s & 90’s Geoffrey A. Moore defined “The Chasm” in early adoption. |
Manufacturing Sector Twitter adoption
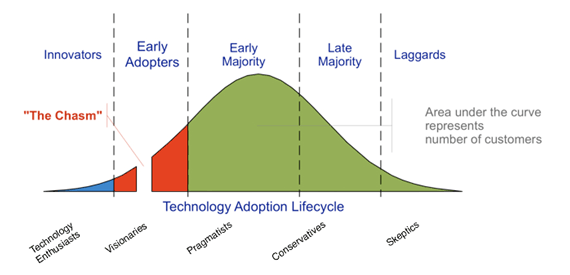
According to Moore, in his 1999 book, “Crossing the Chasm” he defined the chasm as “The most difficult step is making the transition between visionaries (early adopters) and pragmatists (early majority)”. This is the chasm that is depicted in the second graph. Moore went on to say “If a successful firm can create a bandwagon effect in which enough momentum builds, then the product becomes a de facto standard“
In early 2010, GlobalSpec released “Social Media Trends in the Industrial Sector.” The 2010 study found that “At this point, only 9% are using Twitter.” On Feb 22, 2011, GlobalSpec released “Update: Social Media Trends in the Industrial Sector”as a follow-up to their 2010 study.
The 2011 study was quite revealing. It indicated “Currently, only 15 percent have a Twitter account” GlobalSpec’s recommendations for using Twitter where, to say the least, in the “not recommended” category.
By early 2012 marketing adoption, according a new updated report, “Social Media Usage in the Industrial Sector” was released from GlobalSpec. According to that report, Twitter usage had now increased to 22% amongst respondents to the survey.
Population Twitter adoption
At the same time that GlobalSpec was doing their niche surveys regarding industrial adoption, Pew continued to complete their more general adoption rate studies for Twitter as well. To review:
Comparing the Statistics
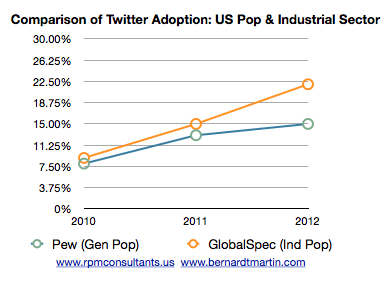 | When we overlay the data from both studies what we find is the the industrial sector seems to be adopting Twitter more quickly than the general population. Both have now “crossed the chasm” Let’s just summarize for a moment what the data tells us:
|
At first glance this would seem to indicate that the industrial sector is adopting Twitter at a much more advanced rate than the general population: That may not be the case within certain vertical markets. First, there are some some obvious caveats with the last chart:
- Comparison between different population studies is always prone to error and we need to acknowledge that.
- Within the Industrial sector there are business “silos” (vertical markets) that include, not only the entire supply chain, but also the end user base of customers. The “industrial population” data from GobalSpec does not contain ‘refined data’ for these individual vertical silos.
What that means
Various articles both here on the B@B Community site and others websites have been, on one hand, big advocates of Twitter, and on the other, have had a rather antagonist view of twitter. It would seem that both views have merit: It all depends on which vertical silo the anecdotal observations are being made.
What we have observed
There are three very large industry trade shows coming up in North America. The International Woodworking Machinery & Supply Fair (IWF) in Atlanta, The International Manufacturing Technology Show (IMTS) in Chicago and the FABTECH show in Las Vegas. The IWF show serves the woodworking vertical industry, IMTS serves the metalcutting market and FABTECH serves the welding and fabrication markets. All are within the ‘industrial’ sector.
However, based upon our observation (because segmented analytics are near impossible to obtain or analyze) these industry silo’s vary in adoption. Of course both have a significant involvement in Twitter at the equipment manufacturer level but from there the segments begin to vary. Whereas the ‘woodworking’ sector has a good many woodworking (end user) shops with a Twitter presence the metalcutting and fabricating sector has little participation at the ‘end user” level, comparatively speaking.
However, based upon our observation (because segmented analytics are near impossible to obtain or analyze) these industry silo’s vary in adoption. Of course both have a significant involvement in Twitter at the equipment manufacturer level but from there the segments begin to vary. Whereas the ‘woodworking’ sector has a good many woodworking (end user) shops with a Twitter presence the metalcutting and fabricating sector has little participation at the ‘end user” level, comparatively speaking.
Why Twitter adoption may vary
In the 1950’s Soloman Asch completed a study which is often called “Asch’s Paradigm” He concluded that within groups of people there was evidence that the power of conformity was a factor in adoption of ideas. Basically, it comes down to peer pressure. Certain industry segmented vertical silo’s have been affected by the social influence of their peers sooner than other silo’s.
Conclusion
So what that means is that “Your results may vary” and you should take that into consideration as you begin to develop your Twitter Strategy moving forward. It is almost certain that more and more adoption will begin to happen at a faster pace moving forward because we have “crossed the chasm”. And don’t forget to leave some room in your tactical plan to account for additional adoption within your vertical silo segments.
 RSS Feed