
This article was originally published on an older version of this website in 2012.
The Evolution of a Field Sales Force
Business starts with a product or idea, someone goes out and sells something to someone near them. More customers are found and more is sold, typically, from the manufacturer directly to the end-user.
At some point the manufacturer of the product comes to their first crux point: One of two courses must be chosen:
1. Develop a Direct Sales Force
2. Develop a Sales Channel Strategy

Within these choices there can be any number of hybrid strategies:
- A direct sales force that calls directly on end-users.
- A direct sales force that calls on industrial distributors and sells through them.
- A direct sales force that calls on “bigger” end-users directly and sells through a distribution channel.
- An independent manufacturer’s agent network that does any of the above already listed.
- Direct sales to industrial distributors.
- The list can go on based upon individual companies and territories.
 | The real key to this is that in most cases the management of the sales channel “evolves” along the path of least resistance. There is, at most, a basic understanding of the market areas rather than a plan or “map” of success. Sales Managers evolve over time as well. Think of a new sales manager like a fur trapper from the last century. He arrives as a tenderfoot and, over time, learns the lay of the land. He protects what he has learned and will only share what she knows with others whom she trusts. |
Ok, so where does forecasting come into play? Typically sales forecasts also evolve based upon “What did we do last year and what do you expect we will do this year?”
There’s nothing wrong with that as long as you just want to do better than the previous year. Too many managers get caught in this closed loop system and fail to look deeper into the the business.
As an example, let’s look at that fur trader again. She’s hired a bunch of trappers and has a successful business. He’s impressed because over time, what used to be a terrible area for trapping has got a really hard working trapper and it’s delivering more business each and every year. But in the “great territory” he suspects that the trapper is not working. Times changed. The trapper in the formorly “bad” territory is sandbagging and only working a few days a week because the Beavers repopulated while in the former “great” territory it’s all “fished out”
But is that really what’s happening?
Sales vs. Marketshare
RULE #1: EVERYTHING in your forecasting should be about developing MARKETSHARE.
Let’s jump back into some big picture stuff.
The reason for this is so that you can adequately gage performance in key market areas. If you gage how your territories are performing based only upon sales volume you will not know who is performing up to par and who is not performing.
If one market has a total market potential of $100M and another has only $4M and both territories are generating the exact same sales volume the territories are not equal. But how do you determine where the markets area? How big are they? How should you separate your territories?
I’m sure you’ve heard "Don't try to eat the whole elephant" but instead taking it one bite at a time. But where to start? Where is the target market for your products?
Marketing Campaigns & Military Campaigns
Let’s take a bit of a sidebar. If you understand that most management theory is based upon Military theory then perhaps the best thing to do is take a look at how the Military plans for success.
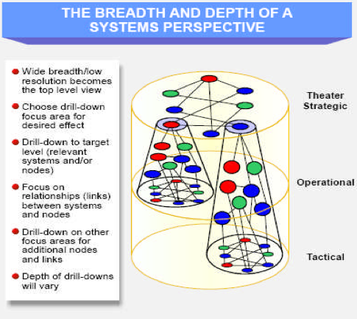
Operations Planning Model
Think about it: If someone is planning something where lives are at stake they are probably going a lot deeper than any marketing campaign you can envision. If you want a ready-made template for planning your marketing Campaign then take a look at The Campaign Planning Handbook from the US Army War College
One of the first things at the tactical level that the military asks is “What is the terrain?” They pull out a map.
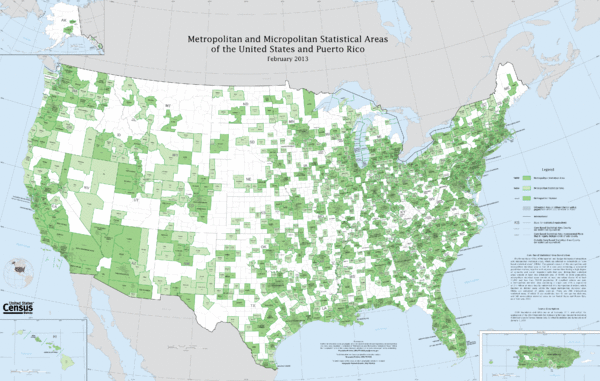
Understanding How MSA's Evolved
Maps are a great visual aid to sales planning and forecasting. So, to start, let’s think about how North America was settled. As the westward expansion took place the United States originally set State boundary lines along easily definable geographic lines such as rivers or mountain chains.
Although many boundaries are along rivers, cities developed on both sides of the river as a result of easy transportation along waterways. Metropolitan areas developed around rivers. Boundaries for States and Counties where also created using the rivers.
Although many boundaries are along rivers, cities developed on both sides of the river as a result of easy transportation along waterways. Metropolitan areas developed around rivers. Boundaries for States and Counties where also created using the rivers.
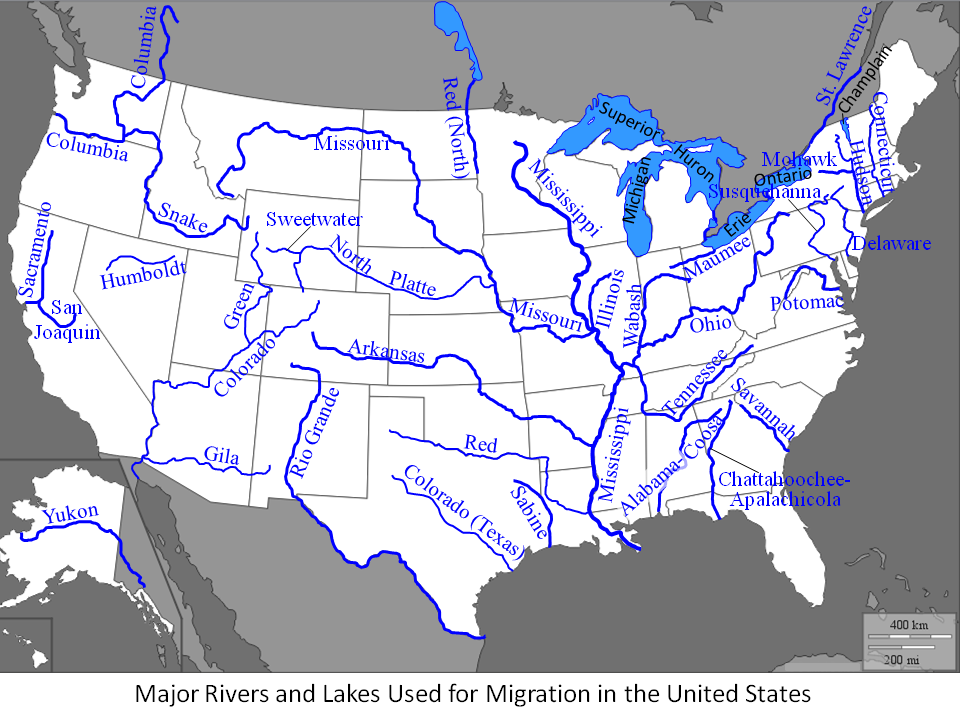
The boundaries of States are not always the best way to define market territories
| Market areas traverse the State Line boundaries. County boudaries where essentially set up the same way. Population centers, and therefore business, developed along these same transport routes. That is why the concept of a Metropolitain Statistical Area, or MSA, is so important. If you are measuring sales success by County it’s almost impossible to see any trends | 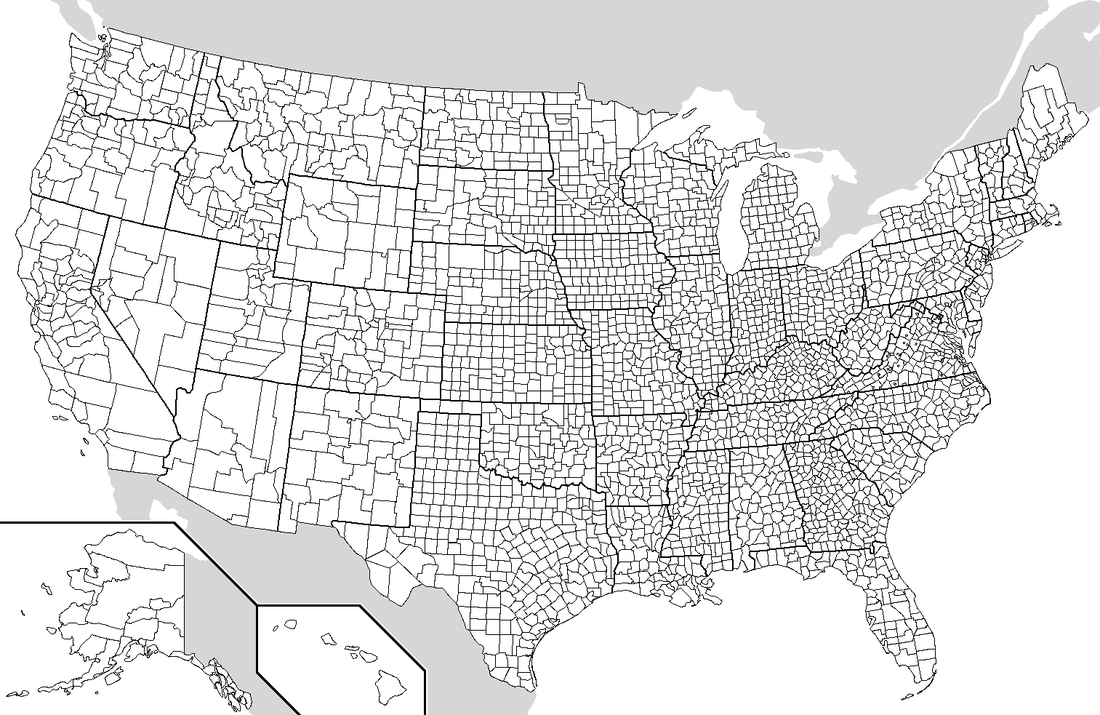 County Boundaries Unites States |
Temninology
The United States Office of Management and Budget (OMB) defines Metropolitan Statistical Areas according to published standards that are applied to Census Bureau data. The general concept of a Metropolitan Statistical Area, an MSA, is that of a core area containing a substantial population nucleus, together with adjacent communities having a high degree of economic and social integration with that core.
MICROs and MSAs are collectively referred to as Core-Based Statistical Areas or CBSAs
According to the 2000 standards
MICROs and MSAs are collectively referred to as Core-Based Statistical Areas or CBSAs
According to the 2000 standards
- Each CBSA must contain at least one urban area of 10,000 or more population.
- Each metropolitan statistical area must have at least one urbanized area of 50,000 or more inhabitants. Each micropolitan statistical area must have at least one urban cluster of at least 10,000 but less than 50,000 population.
Under the standards, the county (or counties) in which at least 50 percent of the population resides within urban areas of 10,000 or more population, or that contain at least 5,000 people residing within a single urban area of 10,000 or more population, is identified as a “central county” (counties). Additional “outlying counties” are included in the CBSA if they meet specified requirements of commuting to or from the central counties. Counties or equivalent entities form the geographic “building blocks” for metropolitan and micropolitan statistical areas throughout the United States and Puerto Rico.
If specified criteria are met, a metropolitan statistical area containing a single core with a population of 2.5 million or more may be subdivided to form smaller groupings of counties referred to as “metropolitan divisions.”
As of 2000, there are 362 metropolitan statistical areas and 560 micropolitan statistical areas in the United States. In addition, there are 8 metropolitan statistical areas and 5 micropolitan statistical areas. You can find a much more detailed map from this US Census Bureau link that you can print out
National Highway System
| So why is this important? If you undersantd that cities originally developed along transportaion systems you can understand how markets have developed. As the ‘west’ was settled cities tended to develop along river tranport systems. By the late 19th century streetcars led to the development of ‘suburbia’ and made room for the immigrant melting pot. Rail systems began to connect major metropolitain areas and by the mid 1960’s the interstate higway system started to connect the major MSA’s. | 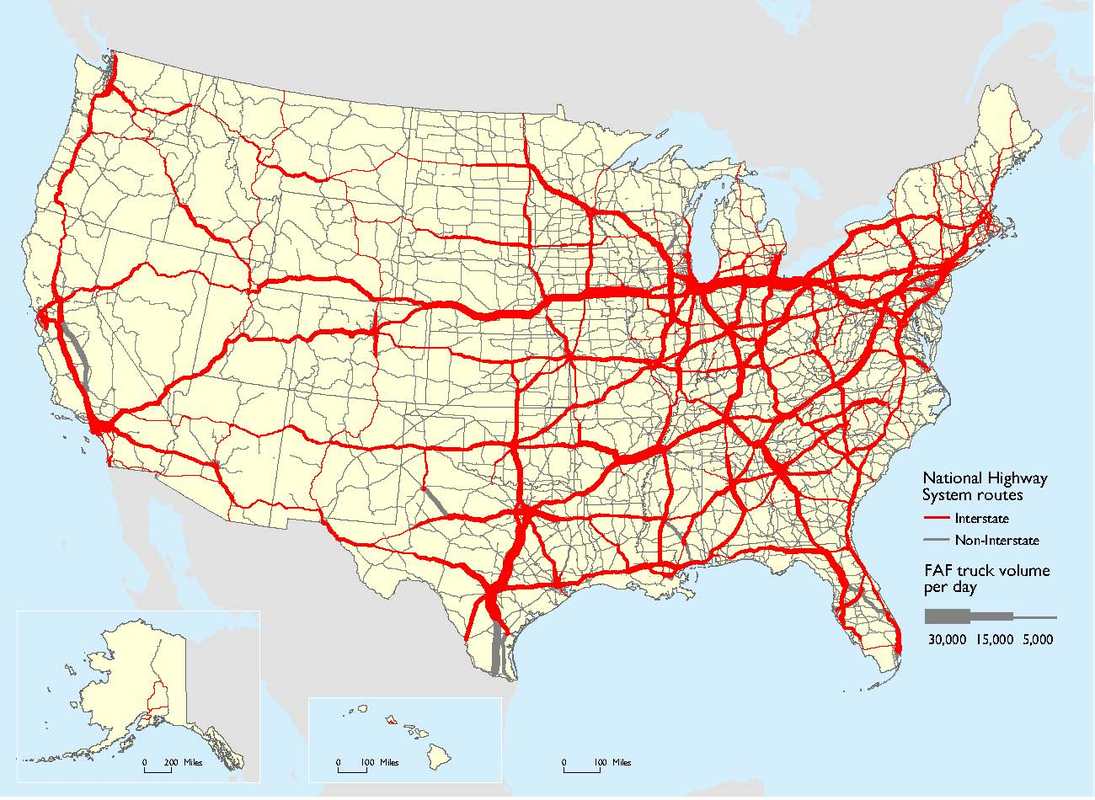 Average Daily Long-Haul Truck Traffic on the National Highway System: 2012 |
Terrain has a Direct Impact on Travel Time
To truly understand marketing areas you must have a good understanding of the topographical terrain and transport routes that support them. Today, markets develop along interstates. If markets are disconnected there will be more “windshield time” between accounts. When reviewing territories it’s always a good idea to understand the limitations imposed by terrain or traffic patterns.
| Performance Evalutation MSA maps are certainly better for taking a look at overall territory structures. Population centers are a good indicator of where business markets are located. But to really drill down into where YOUR industrial business is located in the manufacturing sector, you need to overlay a more detailed business map. These kind of maps can be very very large and space does not permit here to depict one. So instead let’s look at some micro markets. | 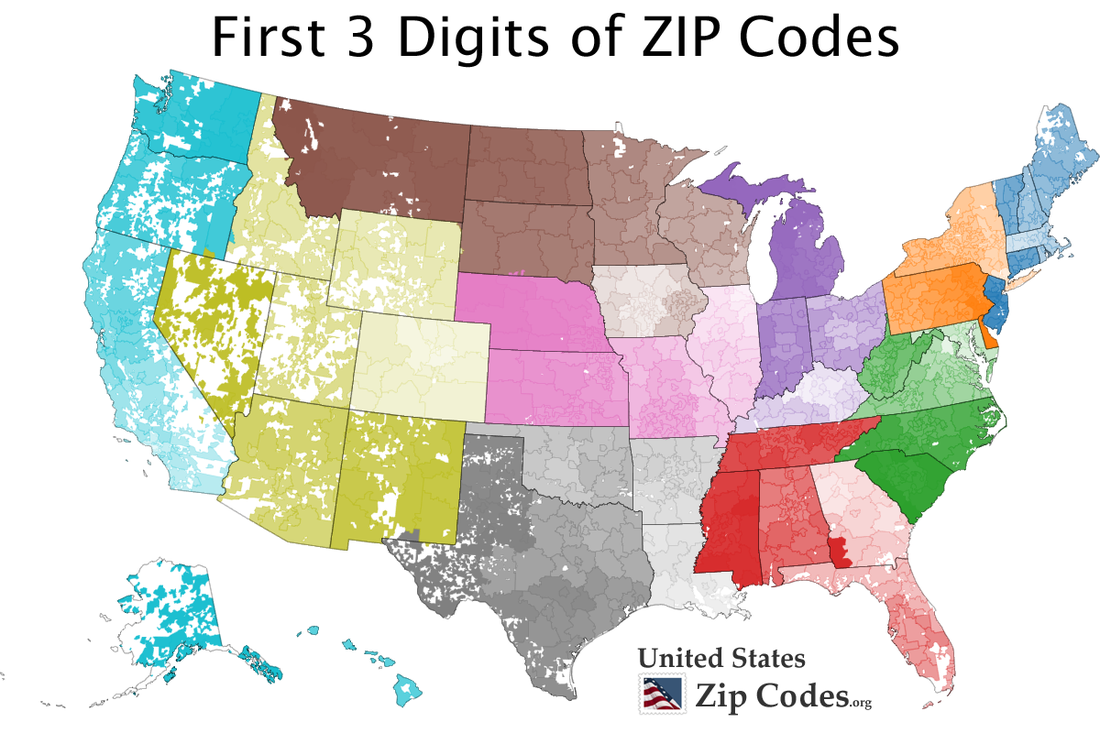 The US Census Bureau created the foundation of the ZIP Code system based upon population centers. MSA’s are a further refinement of that. |
Understanding the Market Areas: A Real World Example
Now we’ll dig into the actual data a bit more. Let’s evaluate two sales territories: Northeast OH and Western PA for SIC codes 33-39.
| Land Mass
| 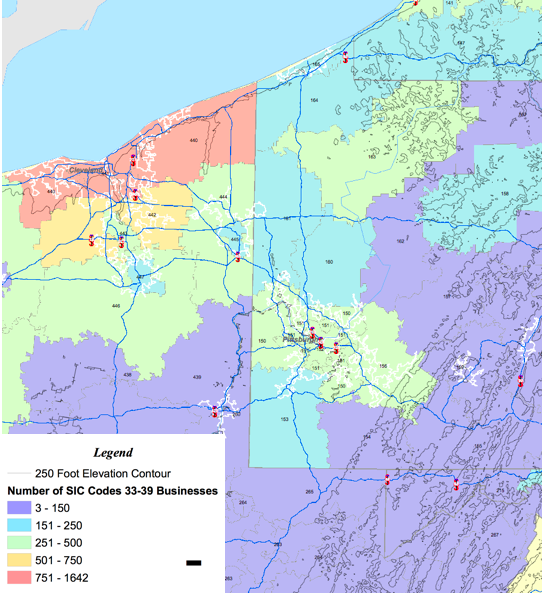 SIC 33-39 Map Of Business NE-OH/W-PA |
USMTO Market Growth Data
| According to the June 2008 USMTC reports we know the following:
Territory Sales Comparison So what to do we know? At first glance Territory 2 had higher sales dollars. But when we dig into the numbers we can see that:
| 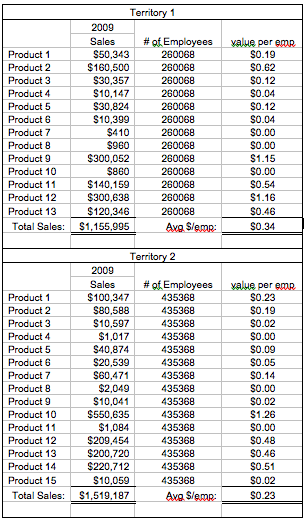 Territory Sales Comparison Example |
What can we learn from this?
The key to this whole discussion is understanding your markets. As opposed to basing your forecasting on past experience or “gut knowledge” of a market area take some time and dig into the data
The key to this whole discussion is understanding your markets. As opposed to basing your forecasting on past experience or “gut knowledge” of a market area take some time and dig into the data
Marketshare Potential is probably the best way to gage your success.
Key Questions to Ask:
Key Questions to Ask:
- Do I have a good understanding of where all of my markets are?
- Do I have a good understanding or market potential in each territory?
- Do I need to look at travel time between accounts?
- Has business developed right around the corner from me that none of my salespeople are calling on?
- Should split at territory?
- Should I enlarge a territory?
- Are my territory boundaries set up correctly?
References
"Standards for Defining Metropolitan and Micropolitan Statistical Areas; Notice." Office of Management and Budget. Federal Register. 27 December 2000.
U.S. Bureau of the Census. "Metropolitan and Micropolitan Statistical Area Definitions." 19 January 2006. Available from http://www.census.gov/population/www/estimates/metrodef.html. Retrieved on 17 April 2006.
U.S. Bureau of the Census. "Metropolitan and Micropolitan Statistical Area Definitions." 19 January 2006. Available from http://www.census.gov/population/www/estimates/metrodef.html. Retrieved on 17 April 2006.
Further Definitions of Statistical Areas
Core-Based Statistical Area
A CBSA is one or more counties with an urbanized cluster of at least 10,000 people. The area as a whole is defined by the interaction between the core and the outlying areas. This interaction, measured by commuting, means that at least 25 percent of people in outlying areas are working in the core. The CBSA is a generic definition of MICROs and MSAs, the difference being core population size.
Micropolitan Statistical Areas
A MICRO is simply a small CBSA, i.e., a county or counties with an urbanized core of 10,000 but fewer than 50,000 in population. Outlying areas included are, again, defined by commuting patterns. As of November 2004, according to the Census Bureau, there were 575 MICROs in the U.S. and five in Puerto Rico.
Metropolitan Statistical Areas
An MSA has an urbanized core of minimally 50,000 population and includes outlying areas determined by commuting measures. In 2004, the U.S. had 361 MSAs and Puerto Rico eight.
 RSS Feed